I fiddled around with prometheus a bit… and then I ended up with a whole documentation and 95% automation of a prometheus instance with mimir and S3-dump to minio.
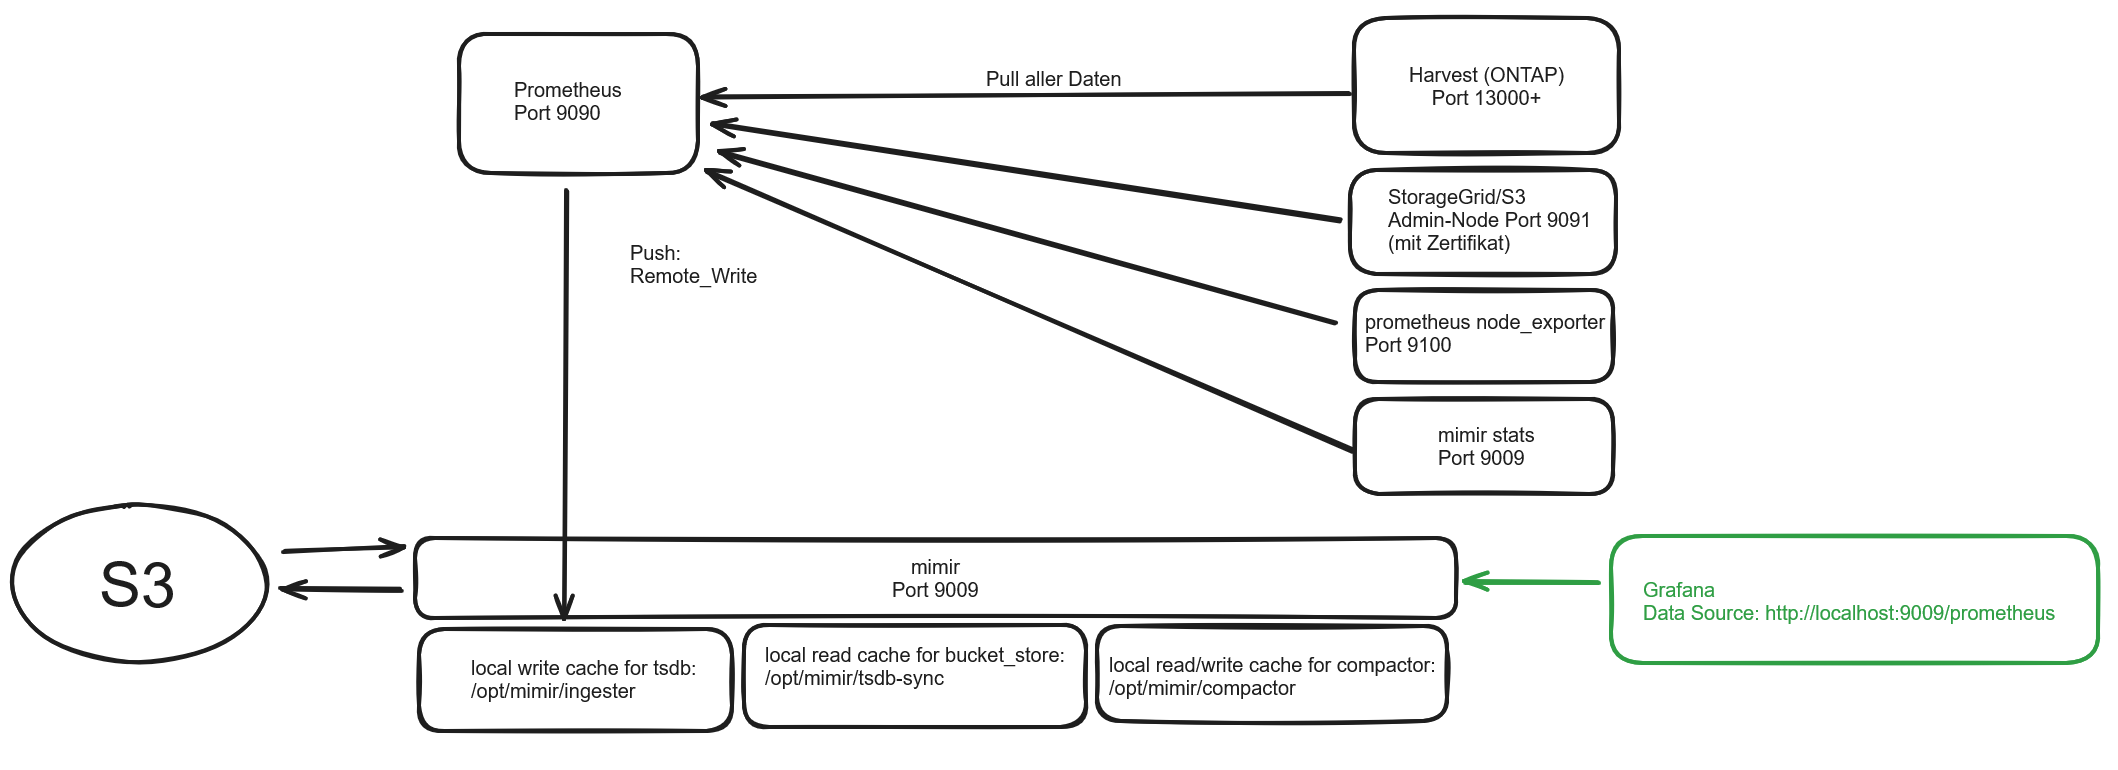
Let’s have a look at all the components involved:
Prometheus
Prometheus gathers time-series data from several sources:
- NetApp Harvest pulls data from NetApp ONTAP- and StorageGRID-Systems
- Prometheus (Port 9090) instances
- Prometheus Node Exporter (Port 9100) from several hosts
- Ceph data
- Proxmox PVE data
- There’s even an exporter for OPNsense 🙂
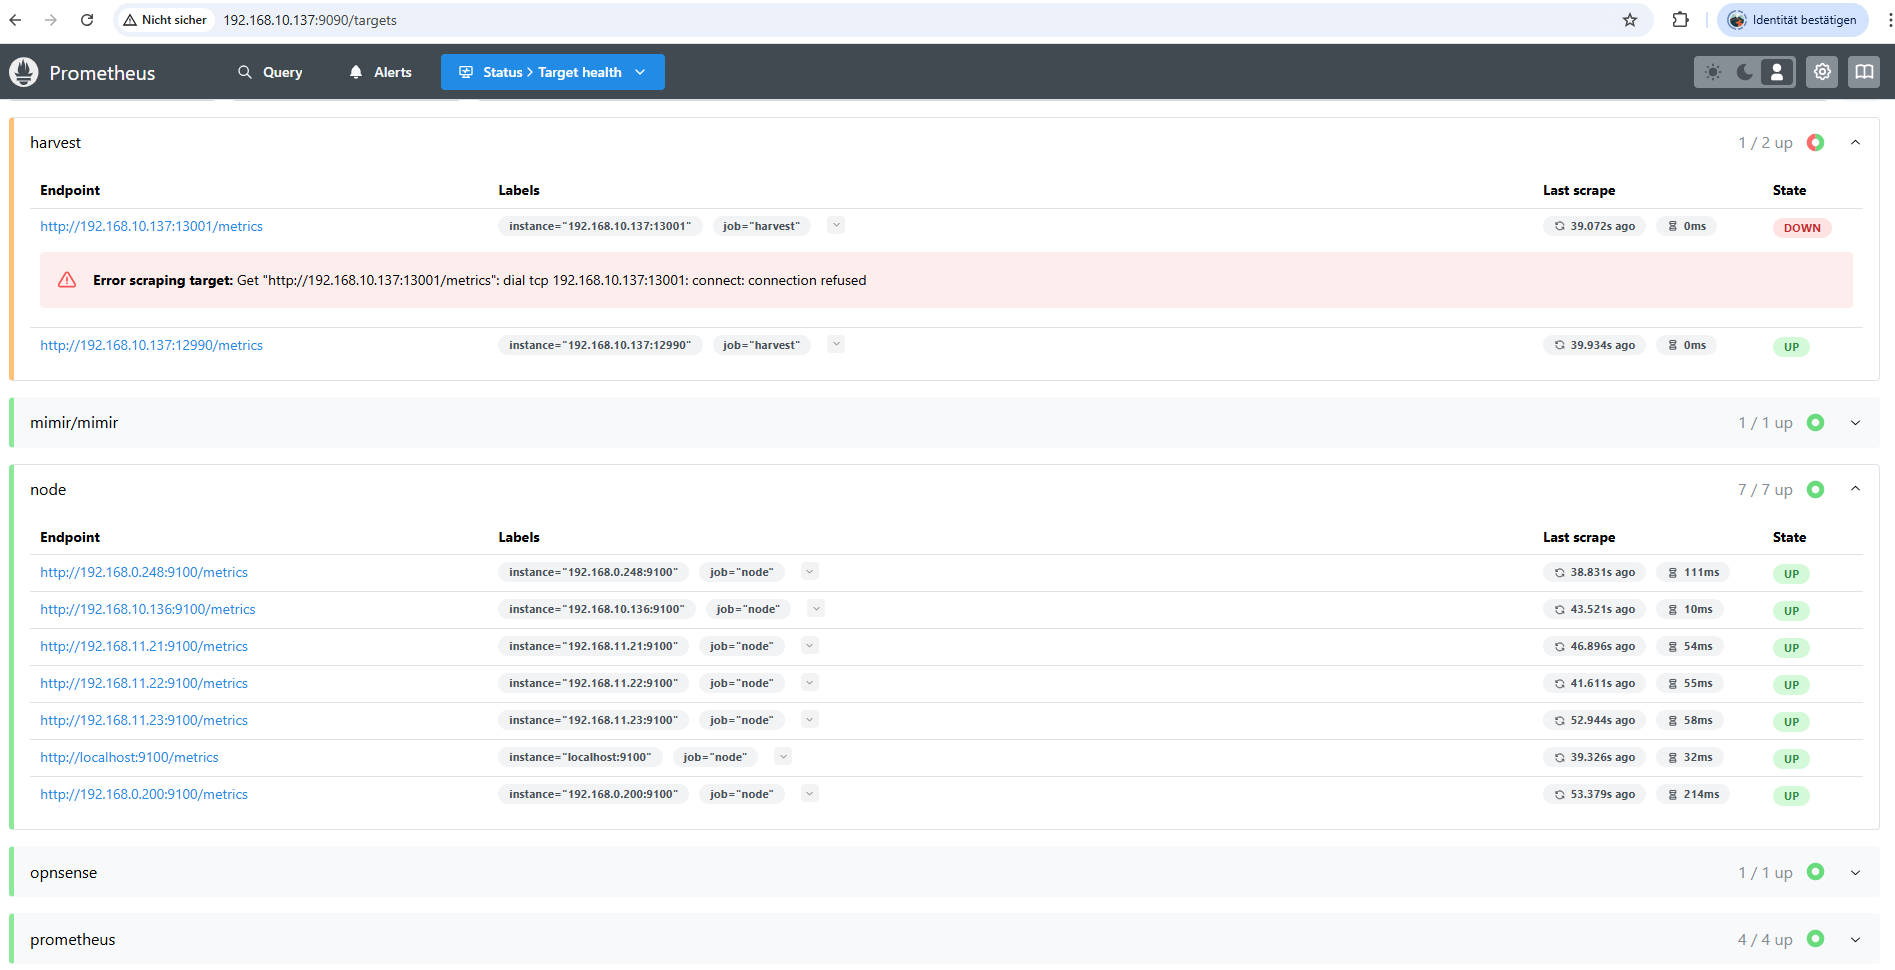
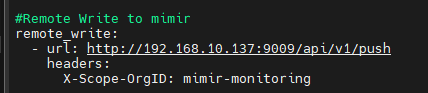
All the data is pulled periodically every few seconds and then forwarded to the mimir instance via the remote_write: directive. The X-Scope-OrgID is used by the Grafana Data Source later…
Mimir
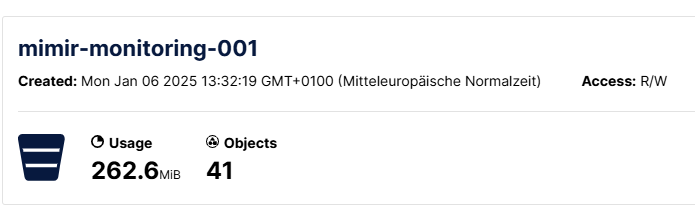
Mimir is configured in a very special way: I only use one instance of every service, no redundancy here… This applies to memberlist, alertmanager, ingester and store_gateway. All data is ingested and kept locally and then pushed to S3 a few times per day. So the mimir instance is in complete control of all the data, long-term and short-term. I do not really know how much data will be stored, but right now I try to keep everything, so retention is set to 10 years…. let’s see if this is a clever assumption… The bucket_name you see in the s3 configuration has to be created manually in minio.
This is my mimir config.yml:
target: all,alertmanager,overrides-exporter

# Configure Mimir to use Minio as object storage backend.
common:
  storage:
    backend: s3
    s3:
      endpoint: 192.168.10.137:9000
      access_key_id: myaccesskey
      secret_access_key: mysecret
      bucket_name: mimir-monitoring-001
      insecure: true


# Blocks storage requires a prefix when using a common object storage bucket.
blocks_storage:
  storage_prefix: blocks
  tsdb:
    dir: /var/lib/mimir/ingester
  bucket_store:
    sync_dir: /var/lib/mimir/tsdb-sync
memberlist:
  join_members: [ localhost ]
activity_tracker:
  filepath: /var/lib/mimir/metrics-activity.log

alertmanager:
  data_dir: /var/lib/mimir/alertmanager
  sharding_ring:
    replication_factor: 1

compactor:
  data_dir: /var/lib/mimir/compactor

ingester:
  ring:
    replication_factor: 1

limits:
  ingestion_rate: 7000000
  ingestion_burst_size: 500000000
  max_global_series_per_user: 40000000000
  compactor_blocks_retention_period: 10y
  compactor_block_upload_enabled: true
  out_of_order_time_window: 20m

ruler:
  rule_path: /var/lib/mimir/ruler
  alertmanager_url: http://127.0.0.1:8080/alertmanager
  ring:
    # Quickly detect unhealthy rulers to speed up the tutorial.
    heartbeat_period: 2s
    heartbeat_timeout: 10s

server:
  http_listen_port: 9009
  log_level: warn
  # Configure the server to allow messages up to 20 GBytes
  grpc_server_max_recv_msg_size: 21474836480
  grpc_server_max_send_msg_size: 21474836480
  grpc_server_max_concurrent_streams: 1000

store_gateway:
  sharding_ring:
    replication_factor: 1
Minio
Minio is responsible for the S3 data and uses a pretty straightforward config: one bucket, one tenant, one access key
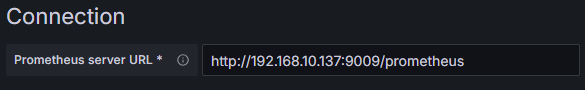
Grafana
Grafana uses a prometheus-compliant data source, the mimir instance. This instance is running on port :9009
So when putting it all together, it’s easier to do everything in reverse order: Start with minio and end with prometheus and harvest.
Leave a Reply